
February Portfolio Recap: Measuring Success on My Own Terms
"Comparison is the Thief of Success"

This update includes trades from the final days of February and marks my first portfolio recap since I began tracking performance in July 2024.
Portfolio Update
I’ve previously expressed my reluctance to share investment performance, both in this newsletter and on social media. The reason is simple: each investor's results will differ due to:
Conviction levels—we may hold the same stock, but you might trim while I add.
Timing—the exact entry and exit points of trades can make a significant difference.
After further reflection, I’ve decided to share my performance, while strongly emphasizing this disclaimer. Copying trades is not the point—nor is it beneficial to anyone. Mimicking another investor without understanding their strategy can be counterproductive.
So, why share performance at all?
Real-time case studies – Learning from live, play-by-play decisions can provide valuable insights. Mistakes and successes alike offer lessons.
Better performance tracking – I want to demonstrate a more thoughtful way to track performance with transparency and proper benchmarking.
Accountability – By publishing my results, I hope to improve my own discipline in capital allocation.
I’m sure there are other reasons, but let’s move forward.
My Performance and Benchmarking
You’ll notice something missing from my chart below: the S&P 500 index. I don’t benchmark my portfolio against external indices.
“Comparison is the thief of joy [success].” - Theodore Roosevelt
Investing should be measured against your own objectives and risk tolerance—not an arbitrary index. This approach reduces fear, minimizes FOMO, and helps keep emotions in check.

That being said, indices do have value. They serve as useful idea generators for portfolio construction and as benchmarks for passive investors using ETFs. I’ll cover ETF allocation in a separate article, but this series focuses on actively managed portfolios built from individual stocks.
I largely exited the market in early 2022, only making smaller swing trade allocations through mid-2024. The portfolio I’m sharing today represents my re-entry, with fresh capital allocated to individual companies. Performance tracking began in July 2024.
The Hurdle Rate: A Personal Benchmark
In the chart below, my benchmark is a 12% CAGR hurdle rate—not the S&P 500.
Why? Because this is the rate I personally aim for in long-term compounding. Comparing against this benchmark helps me remove emotional biases and focus on allocation and execution rather than short-term fluctuations.
Does this mean I don’t care about monthly volatility? No. But short-term underperformance or outperformance doesn’t concern me—the goal is to be at or above that red line over time.

Portfolio Takeaways
Here are a few key observations from my first 8 months:
I have held a substantial cash balance (30–60%) for much of this period. Including cash secured by puts, my current cash allocation is 31% (as of 2/28/2025).
February performance: -3.46%, of which Teleflex (TFX) alone contributed -1.5%.
The line chart represents VAMI (Value of $1,000 invested at inception on 7/1/2024).
The red line is my 12% CAGR benchmark—it tracks how a $1,000 investment would grow at that rate over time.
My holdings are primarily long-term, but I also overlay swing trades and use cash-secured puts to optimize cash yield.
This is the first of my monthly recaps. Even though I’m already 8 months in, I’ll be publishing these updates regularly going forward.
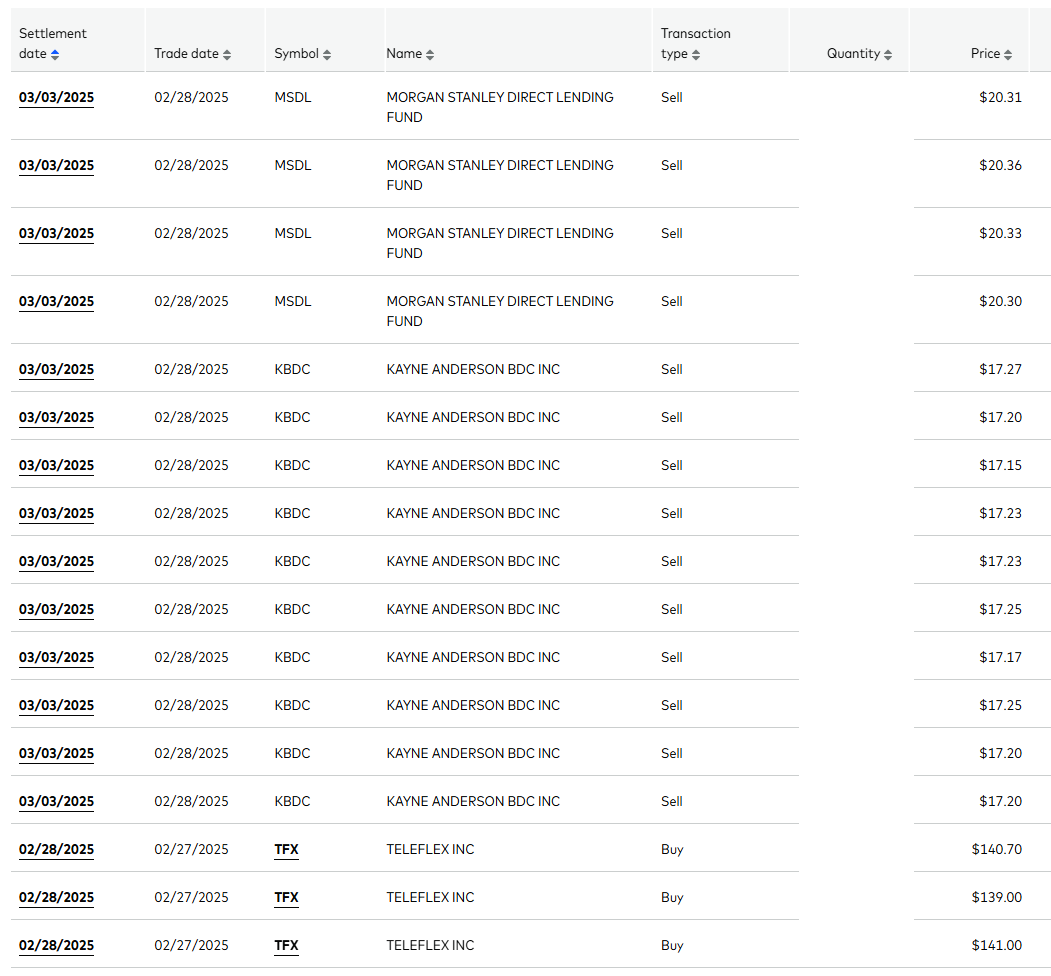
Trades: 2/26/25 - 2/28/25
Here’s a recap of my trades in the final days of February:
Exited BDC holdings – Sold Morgan Stanley Direct Lending (MSDL) and Kayne Anderson BDC (KBDC). While they’ve provided solid yield, I’m reducing exposure to credit-sensitive assets amid policy shifts in the new administration. For now, I prefer money market funds (MMFs) and strategic use of cash-secured puts.
Increased Teleflex (TFX) position – After the earnings-driven selloff on Feb 27, I added more TFX shares and continued buying into early March in the low $130s.

Sold a PYPL put – Sold a $60-strike put on PayPal (PYPL) for a 13% annualized premium on secured cash.
Reinitiated a position in Intermex (IMXI) – Bought back into Intermex (IMXI) after a 20% post-earnings selloff. I had previously exited at $18.60, but the recent dip makes this a compelling investment again.

Final Thoughts
Tracking performance against your own hurdle rate fosters discipline and keeps you focused on long-term objectives. While short-term fluctuations are inevitable, the key is maintaining a process that leads to consistent compounding over time.
This February recap marks the start of a monthly series, where I’ll continue refining and improving my portfolio strategy. Stay tuned for the next update!
Thanks for being part of the Safe Harbor community! Follow me for more insights: LinkedIn | X (formerly Twitter) | Instagram | YouTube
Disclosure: This information is provided for informational purposes only and should not be considered a solicitation or recommendation to buy or sell any securities. The author or entity providing this information may hold positions in the securities discussed. This is not investment advice.
thanks for the update. Curious how Teleflex works out.